State of water environmental issues
 |
| Major Water Bodies of Japan |
Major Rivers in Japan
| |
Ishikari River |
Tokachi River |
Kitakami River |
Mogami River |
Tone river |
Arakawa River |
Tama River |
Shinano River |
| Length of mainstream (km) |
268 |
156 |
249 |
229 |
322 |
173 |
138 |
367 |
| Catchment area (km²) |
14,330 |
9,010 |
10,150 |
7,040 |
16,840 |
2,940 |
1,240 |
11,900 |
| Yearly averaged discharge (m³/s.) |
133.18 |
85.36 |
318.42 |
369.26 |
237.10 |
27.77 |
40.28 |
503.15 |
| Population in river basin area |
2,605,000 |
337,000 |
1,362,000 |
981,000 |
12,794,000 |
9,756,000 |
3,780,000 |
2,944,000 |
| |
Fuji River |
Tenryu River |
Kiso River |
Yodo River |
Gouno River |
Ota River |
Shimanto River |
Chikugo River |
| Length of mainstream (km) |
128 |
213 |
229 |
75 |
194 |
103 |
196 |
143 |
| Catchment area (km²) |
3,990 |
5,090 |
5,275 |
8,240 |
3,900 |
1,710 |
2,186 |
2,863 |
| Yearly averaged discharge (m³/s.) |
58.91 |
239.67 |
291.05 |
267.51 |
75.17 |
78.81 |
121.02 |
95.09 |
| Population in river basin area |
1,149,000 |
718,000 |
1,900,000 |
10,986,000 |
184,000 |
1,009,000 |
94,000 |
1,110,000 |
Major Lakes in Japan
| |
Lake Kasumigaura |
Lake Biwa |
| Surface area (km²) |
220 |
674 |
| Maximum depth (m) |
7 |
104 |
| Mean depth (m) |
4 |
41 |
| Catchment area (km²) |
2,157 |
3,848 |
| Population |
970,000 |
1,411,000 |
The Present State of Water Resources in Japan
The mean annual precipitation is about 1,700 mm (650 billion m³) in Japan, which is more than the global mean precipitation (900 to 1,000 mm). About 35 % of the precipitation amount is lost through evapotranspiration, and the amount of water available is about 420 billion m³. It is likely that Japan is a country with the large amount of precipitation. However, the change of stream-flow is large in Japan through a year. The time of the large stream-flow increased by melted snow, rain in a rainy season and the typhoon and the time of little stream-flow are repeated. Therefore, in order to use water resources stably, there is a growing need of water development, such as a dam and a weir.
Indeed, about 85.2 billion m³ of water resources
was used in 2002. The amount of the water resources
was broken down into about 16.3 billion m³ for the
domestic water use, about 12.3 billion m³ for industrial
water use and about 56.6 billion m³ for agricultural
water use. With an increase in population, expansion
of economic activities, and the change of lifestyles,
such as the spread of flush toilets, the water for domestic
and industrial use was almost three times increased
from the middle of 1960s to 2000. However, the amount
of water used for household remained unchanged, but recently
it has been on the downward trend. The recycling
of industrial water has been developed. As a result, the
amount of water that has to be additionally taken from
water sources, such as rivers, is gradually decreasing.
Among the use of domestic water, the household water use was roughly broken down into toilets (about 28%), bathes (about 24%), cooking (about 23%), and laundry (about 17%). The items of water use aiming at washing account for a large share of the domestic water use. With regard to agricultural water use, more than 90 % of water has been used for rise-paddy irrigation. The rate of water use for dry filed and livestock has slightly been increasing each year.
The reinforced effluent regulations for factories have been effective in improving water quality, but problems with domestic effluent remain and efforts to improve this situation have lagged because of, for example, insufficient sewage treatment system infrastructure.
In addition to physical characteristics of enclosed or semienclosed water bodies, such as low water turnover rates, another important factor contributing to water quality problems is concentration of people and industries in these catchment areas. The infrastructure inability to keep up with expanding population, and residential and industrial development, has resulted in polluted water.
For the rivers in the urban areas in which populations and industries are concentrated near the basin, and lakes and reservoirs whose basins are urbanized like Teganuma and Inbanuma, the capacity of the sewage system cannot follow the increase in population. Therefore, in these areas the domestic effluent shares the large part of the effused burden.
Non-point source pollution, which originates from broad areas such as urban developments and agricultural fields, combines with rainfall and pollutes receiving waters. Accumulated pollution can result from release of pollutants from bottom sediments which were already brought from land.
As for as the environmental quality standards for human health are concerned, their requirements have been achieved in almost all monitoring site.
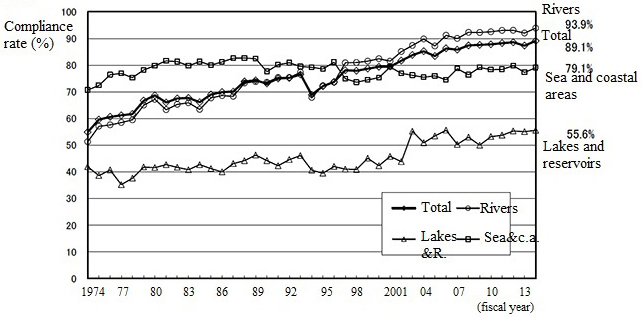
As for the environmental quality standards for conservation
of the living environment, their achievement
rate of BOD has been improving in the last decade.
In fiscal year 2014, the compliance rate was 93.9%.
As for as the environmental quality standards for human health are concerned, their requirements have been achieved in almost all monitoring site.
As for the environmental quality standards for conservation of the living environment, their achievement rate of COD has been changing at almost the same level as the past. In fiscal year 2014, the compliance rate was 79.1%.
The Environmental Quality Standards (EQS) have been attained in a smaller proportion of narrow bays, semi-enclosed seas, lakes and reservoirs than in other public water areas in Japan. Eutrophication in such enclosed water areas tends to be more severe because of the chronic loading of nutrients including nitrogen and phosphorus. In fiscal year 2014, CODs are only 63, 50, and 78% of water bodies in Tokyo, Ise, and Seto Inland Sea, respectively.
Red tides (Akashio) bloom frequently in such enclosed marine waters. A phenomenon which brings an anoxic water mass to the surface named a blue tide (Aoshio) has been observed in Tokyo Bay. Many lakes and reservoirs suffer from intense blooms of cyanobacteria (Aoko). More surveys, studies, and countermeasures should be implemented to conserve water quality in enclosed water bodies and to combat these phenomena.
The nationwide general surveys (those surveys implemented to comprehend the overall status of the groundwater quality in each local communities) were conducted in fiscal year 2014 and 211 out of 3,405 wells exceeded the standard value. Nitrate nitrogen and nitride nitrogen added in Environmental Quality Standards for Groundwater in February 1999, 2.9% wells exceeded the standard value.
Of all drinking water sources, surface river and stream water accounts for about 70% and is greatly influenced by water pollution in public water bodies. Groundwater used to be a high quality of water sources but has been increasingly polluted by toxic substances. Moreover, a problem of organic chlorinated compounds (e.g. trichloroethylene) in the drinking water has occurred, and social concern over it is increasing.
| Figure: Compliance Rates of Environmental Quality Standards (EQSs) for Living Environment Items |
 |
| Reference: |
“Annual Report on the Environment in Japan
2014” (in Japanese) |
| |
“Water Resources in Japan 2014” (in
Japanese) |
|
